

Operational analytics turns raw interaction and satisfaction data into measurable gains in CSAT, resolution rates and compliance risk reduction. The first action is simple: pick one business goal and one or two KPIs that map to it, such as raising first contact resolution or cutting average resolution time. Frameworks like ISO 10004 and established support metrics lists give you a tested starting point rather than guesswork.
TL;DR:
- Track CSAT and first contact resolution alongside handling time; segment results by player tier, channel, issue, geography, and time window to expose misleading averages.
- Clean inconsistent tags before building dashboards, assign an owner to each metric, and pilot one KPI with exception alerts before expanding the system.
- Automate routine routing and alerts for SLA breaches or sentiment spikes, but retain human review for regulated messages and unfamiliar cases.
- Experiments found blended routing can raise first contact resolution while reducing handling time and time to answer compared with first in, first out routing.
- Assign recurring issues to the team that can fix them, then verify success through lower related ticket volume or faster resolution, not ticket closure alone.
Table of Contents
- What operational analytics for support actually means
- Why operational analytics matters for support teams
- Key support metrics to track and how to read them
- Step-by-step implementation: from goals to governance
- Routing and prioritisation: balancing speed and resolution quality
- Real-time analytics and where human review stays essential
- Turning insights into action across teams
- Operating analytics in regulated support environments
- A compliance-aware route to operational analytics and automation
- FAQ
- Sources
What operational analytics for support actually means
Operational analytics is the continuous analysis of support interactions and outcome data to drive day-to-day operational decisions, not quarterly reviews. It draws on ticketing systems, chat transcripts, CRM fields, call recordings, CSAT and NPS surveys, and product logs, then feeds those signals back into staffing, routing and process changes.
That continuous, closed-loop quality separates it from periodic business intelligence reporting, which tends to summarise what happened last month, and from product analytics, which tracks how customers use a product rather than how support resolves their problems. Operational analytics sits closer to the front line: it can flag a spike in negative sentiment promptly, rather than leaving you to discover the trend later. Done well, it closes the loop between detecting an issue and fixing whatever caused it, whether that is a broken feature, a confusing policy or an undertrained agent group.

Why operational analytics matters for support teams
Teams that track operational data consistently tend to see improved CSAT, fewer repeat contacts, and shorter handling times without sacrificing quality, because the data shows which changes actually move the needle rather than which ones feel intuitive. Analytics-led decisions often outperform intuition because standard metrics can mask missed opportunities that only show up once you dig into the underlying patterns.
ISO 10004:2018 gives teams a structured way to define satisfaction objectives and segment data by customer, market or product type, so findings point at real improvement opportunities rather than noise. In a 2024 state of service survey, CSAT and customer retention were each selected by 31% of respondents as top-priority metrics, which signals where most service leaders focus their measurement effort. Faster SLA compliance and reduced revenue exposure from unresolved issues follow naturally once a team starts routing insight into action rather than letting it sit in a dashboard nobody reads.
Key support metrics to track and how to read them
Not every metric deserves equal weight, and chasing the wrong one creates perverse incentives, such as agents rushing calls to protect average handling time while resolution quality drops.
- CSAT measures satisfaction immediately after an interaction and is one of the most tracked service metrics.
- First contact resolution (FCR) shows what share of issues close on the first interaction, a strong proxy for quality.
- Average handling time (AHT) and average response time measure speed, but mean little without a quality metric alongside them.
- Average resolution time tracks how long an issue stays open across the full ticket lifecycle, not just one touch.
- Ticket backlog and interactions per ticket reveal workload pressure and whether issues are being bounced between agents.
- Preferred channel and NPS, where relevant, round out the picture of how and why players reach out.
Single metrics mislead on their own, which is why blended indices such as an AAHT-style measure or a pµ-style resolution probability score matter: they weigh speed against the likelihood of actually solving the problem. Segment everything by VIP versus standard players, by channel, by issue type, by geography and by time window, because an average that blends a VIP escalation with a routine password reset tells you very little about either.
Step-by-step implementation: from goals to governance
A rollout works best as a sequence rather than a single big-bang project.
- Define business objectives and map them to one or two KPIs. ISO 10004 guidance recommends setting explicit objectives and segmenting by customer, market or product type before you collect anything.
- Inventory and prioritise data sources. List every system that holds interaction data, agree consistent field definitions, and fix quality issues such as inconsistent tagging before you build anything on top.
- Choose architecture around real-time feeds, audit trails, channel integration and compliance features. These criteria should drive vendor or tooling decisions more than feature lists, especially in regulated markets where every outgoing message may need a record.
- Build dashboards and alerts that highlight exceptions and trends, not just averages. A rolling average can hide a bad morning; an alert on a sudden CSAT drop or SLA breach catches it while you can still act.
- Set governance: owners, escalation playbooks, a measurement cadence and a continuous improvement loop. Without a named owner for each metric, dashboards become decoration rather than a management tool.
Pro Tip: Start with one KPI and one dashboard view before expanding; a narrow pilot that proves value is easier to scale than a sprawling one that nobody trusts.
Automated, continuous measurement from existing tooling gives finer-grained, real-time visibility than periodic surveys and supports faster decision-making, though it works best alongside manual input for anything the automated systems cannot see directly.
Routing and prioritisation: balancing speed and resolution quality
Routing rules built purely around speed tend to produce more callbacks, because an agent who resolves a case quickly but incorrectly simply shifts the problem downstream.
- Routing research proposes a pµ index, call resolution probability multiplied by service speed, and shows that routing to the agent or class with the highest pµ when available minimises the average total time to resolve an issue.
- Blended indices such as AAHT combine AHT and FCR so a routing rule cannot reward speed alone at the expense of quality; experiments found such rules can raise FCR while lowering both AHT and average speed of answer compared with simple first-in-first-out routing.
- To pilot this, measure per-agent resolution rates by issue type, simulate a pµ-weighted routing rule against your current one, then run a small live experiment while watching ASA, AHT and FCR together rather than any single figure.
Real-time analytics and where human review stays essential
Automated, real-time metrics catch problems faster and with fewer errors than manual consolidation, which typically lags by hours or days and depends on someone remembering to pull a report. Common real-time use cases include SLA breach alerts, sudden negative sentiment spikes, VIP escalation triggers and marketing suppression flags that stop promotional contact with a player who has just complained.

The practical answer is a hybrid approach: automate routine routing and detection work, but keep human review in place for compliance-sensitive messaging and any edge case a model has not seen before. Retaining a full audit trail of what was detected, who reviewed it and what was sent matters as much as the detection itself in a regulated environment.
Turning insights into action across teams
Analytics only pays off once a detected pattern reaches the team that can actually fix it. A simple handoff workflow keeps that from stalling: detect a pattern, tag and assign it to the owning team, product, operations or compliance, implement the fix, then verify the impact against the original metric.
- Repeat contacts about a specific feature usually belong with product, verified by a drop in related ticket volume.
- Slow resolution on a policy question usually belongs with operations or compliance, verified by shorter resolution time on that issue type.
- Rising escalations from one channel usually belongs with the channel owner, verified by fewer VIP complaints on that channel.
A closure policy that tracks each issue to measured resolution, rather than just to a ticket being marked closed, stops the same pattern from quietly reappearing next quarter.
Operating analytics in regulated support environments
Analytics and compliance are not in tension when governance is built in from the start. Audit trails and human review are not a brake on automation; they are what makes automation defensible when a regulator or a player disputes a decision later. The practical starting point stays the same regardless of sector: define your objective, segment your data properly, and let the metrics tell you where to look next rather than confirming what you already believed.
— pitbot
A compliance-aware route to operational analytics and automation
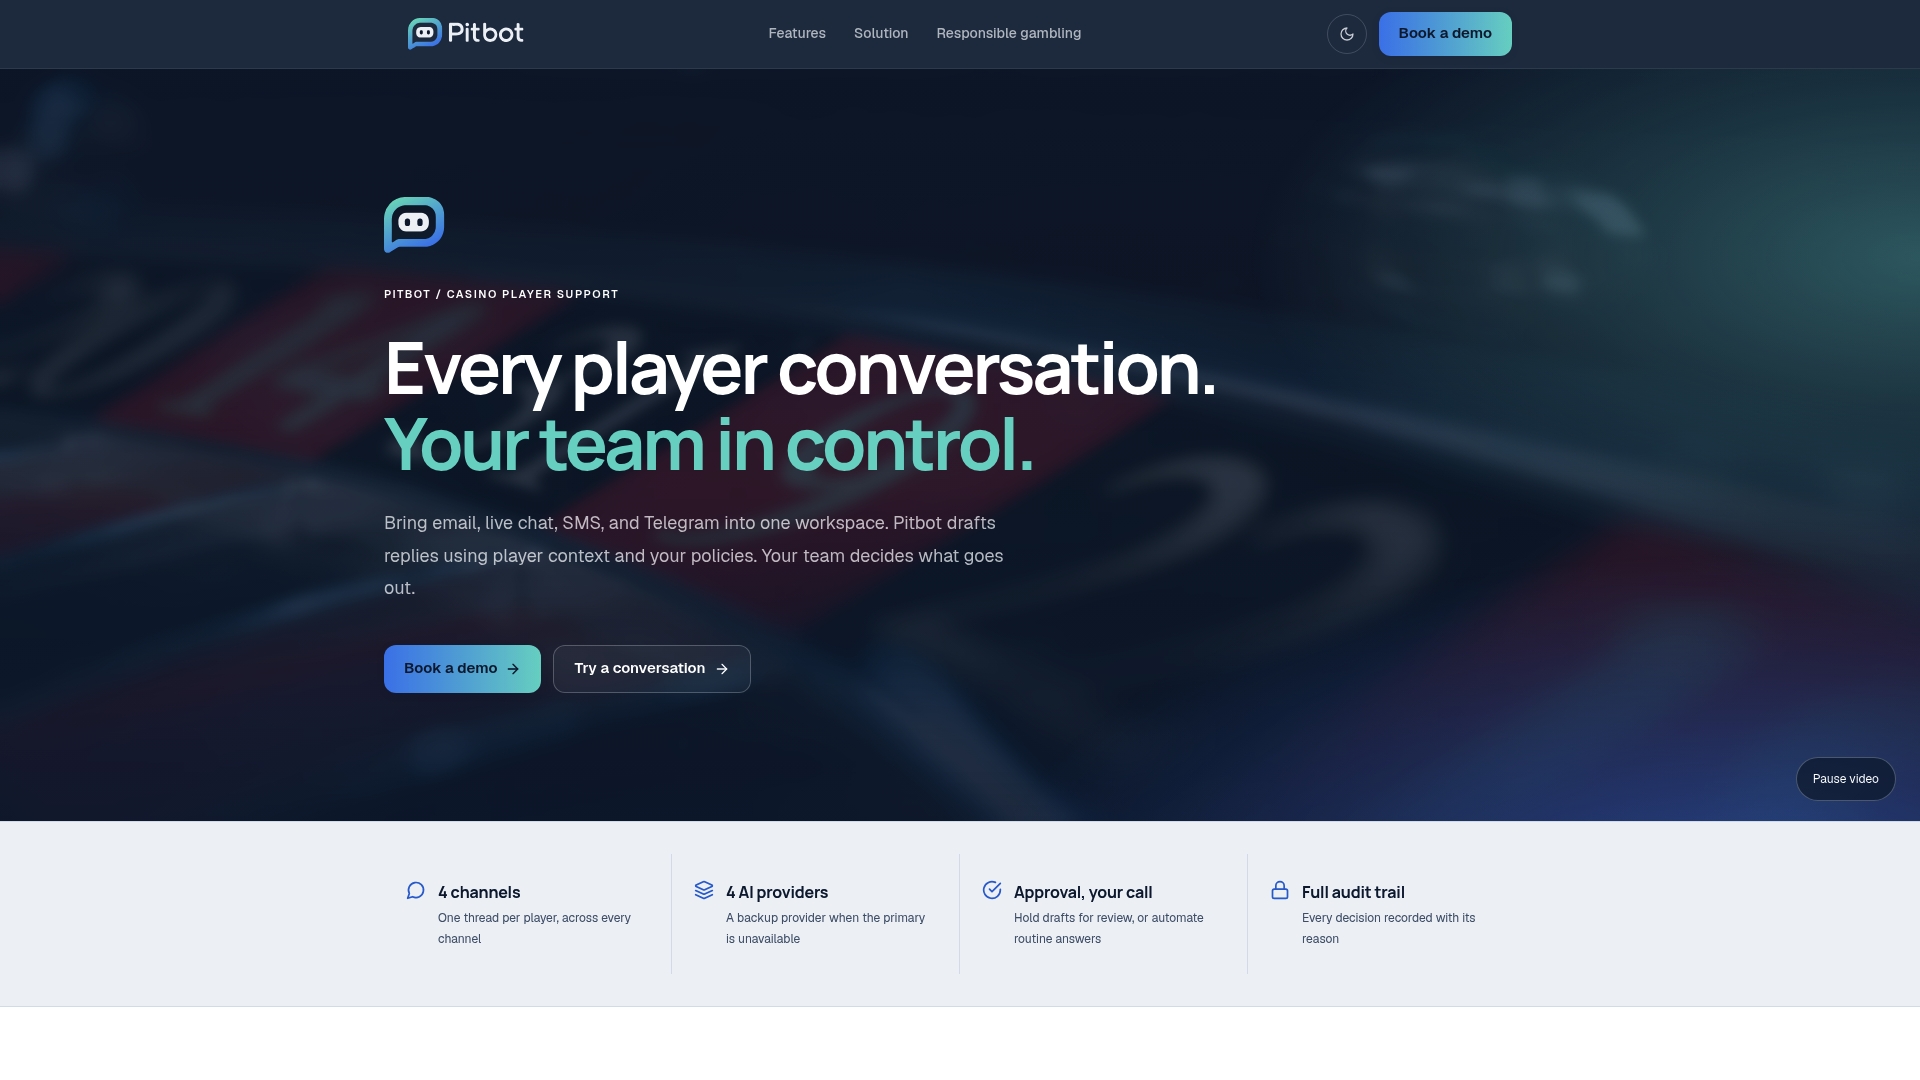
Building all of this in-house, real-time dashboards, routing logic, audit trails and multi-channel integration, takes real engineering time that most support teams would rather spend on players. We built Pitbot to give casino operators that operational analytics layer already connected to the channels where players actually reach out: email, live chat, SMS and Telegram, with the option to hold AI-drafted replies for staff approval before they reach a player.
That human-in-the-loop step keeps speed and compliance together rather than trading one for the other, and it produces the audit trail regulated markets expect as a by-product of normal operation rather than extra paperwork. Our dashboards track sentiment, AI handle rate, time to first response, first-contact resolution, and reopen and repeat-contact rates, and you can filter them by channel, VIP level and language, so nobody has to stitch reports together by hand. If you manage support for an online casino or iGaming operator and want to see how this fits your existing stack, visit our features page or get in touch for a demo.
FAQ
What does operational analytics mean in a support context?
Operational analytics means the continuous, day-to-day analysis of support interaction and outcome data, such as tickets, chats and satisfaction scores, used to make immediate operational decisions. It differs from periodic business reporting because it feeds findings back into routing, staffing and process fixes in near real time.
What are the steps involved in the business analytics process for support?
The practical sequence is to define objectives and KPIs, inventory and clean your data sources, choose tooling around real-time and compliance needs, build dashboards and alerts, then set ongoing governance and review. ISO 10004 recommends starting with clear objectives and proper segmentation before collecting any data.
Which metrics should support teams track first?
Start with CSAT and first contact resolution, since these were each cited by 31% of service leaders surveyed as top priorities, then add average resolution time and backlog as your measurement matures. Avoid relying on average handling time alone, since it rewards speed over quality on its own.
How does real-time analytics improve support operations?
Real-time analytics catches problems such as SLA breaches or sentiment spikes as they happen rather than in a report days later, which shortens the time between a problem appearing and someone acting on it. Automated measurement also reduces the manual errors common in periodic, hand-built reporting.
How can operational analytics support VIP player communication?
Operational analytics can flag VIP interactions for faster routing, track satisfaction and resolution separately for that segment, and trigger escalation when sentiment drops. Platforms like Pitbot let you slice response time and resolution metrics by VIP level, and let you hold AI-drafted replies for staff approval, so VIP communication can stay both fast and compliant.
Sources
- ISO 10004:2018 - Quality management — Customer satisfaction — Guidelines for monitoring and measuring
- 11 Customer Service & Support Metrics You Must Track New Data
- Fully Automated DORA Metrics Measurement for Continuous Improvement
- Managing Response Time in a Call Routing Problem

